A couple of weeks ago, I put online three Storj farming nodes. Two of them are hosted on my OVH dedicated servers and I even built my own node with Meccano, a Raspberry PI and four old used hard drives.
After putting them online, I found myself connecting every day on those three different machines to run storjshare status, htop, iotop and even ifconfig to gather metrics and understand how my nodes were behaving. While this could be OK at first, this doesn’t seem to be a good solution in the long run.
Monitoring your nodes and their host is really important to help you understand how they perform, how to improve their efficiency over time and of course, being alerted if something goes wrong. As you know, the more your node is online, the more data it will collect.
To simplify the monitoring process, I setup a very classic combination of Grafana, influxdb and collectd. Feel free to replace each one of these components by one of their many alternatives, according to your likings. Have a look at Telegraf for example to replace Collectd.
Setup your Storj monitoring stack
First thing to do is to setup collectd which will be responsible to collect metrics from your host and from storj-daemon RPC port. Assuming your using debian, run the following command:
sudo apt install collectd
Then setup the Storj collectd plugin by running:
npm install -g storj-collectd-plugin
Now, edit config file /etc/collectd/collectd.conf to enable the plugins your interested in. At least, configure the network plugin with the IP address or domain name of the webserver on which you will setup InfluxDB (127.0.0.1 if influxdb is on same host) and add a plugin exec entry for the collectd-storj-exec-plugin:
LoadPlugin ...
LoadPlugin exec
LoadPlugin network

<Plugin network>
  Server "IP_SERVER_INFLUXDB" "25826"
</Plugin>

<Plugin exec>
        Interval 120
        Exec "youruser" "collectd-storj-exec-plugin"
</Plugin>
Finally, add the following lines in /usr/share/collectd/types.db:
peers                   value:GAUGE:0:U
shared                  value:GAUGE:0:U
restarts                value:GAUGE:0:U
Don’t forget to restart collectd service:
systemctl restart collectd
Repeat the operation on every node’s host.
It’s now time to setup influxdb. Assuming your still using debian, run the following commands:
curl -sL https://repos.influxdata.com/influxdb.key | sudo apt-key add -
source /etc/os-release
test $VERSION_ID = "7" && echo "deb https://repos.influxdata.com/debian wheezy stable" | sudo tee /etc/apt/sources.list.d/influxdb.list
test $VERSION_ID = "8" && echo "deb https://repos.influxdata.com/debian jessie stable" | sudo tee /etc/apt/sources.list.d/influxdb.list

sudo apt update && sudo apt install influxdb
See documentation for more informations on the setup process.
Then, enable influxdb collectd listener by adding the following lines in /etc/influxdb/influxdb.conf:
[collectd]
  enabled = true
  bind-address = ":25826"
  database = "collectd_db"
  typesdb = "/usr/share/collectd/types.db"
Restart influxdb:
sudo systemctl restart influxdb
Finally, install Grafana wherever you want by executing:
wget https://s3-us-west-2.amazonaws.com/grafana-releases/release/grafana_4.2.0_amd64.deb
sudo apt-get install -y adduser libfontconfig
sudo dpkg -i grafana_4.2.0_amd64.deb
See documentation for more informations on the setup process.
Build a cool handy dashboard in Grafana
Now that everything is setup, collectd should already be sending metrics to your influx datastore and you should be ready to create your very own dashboard on Grafana.
Here is what mine is currently looking:
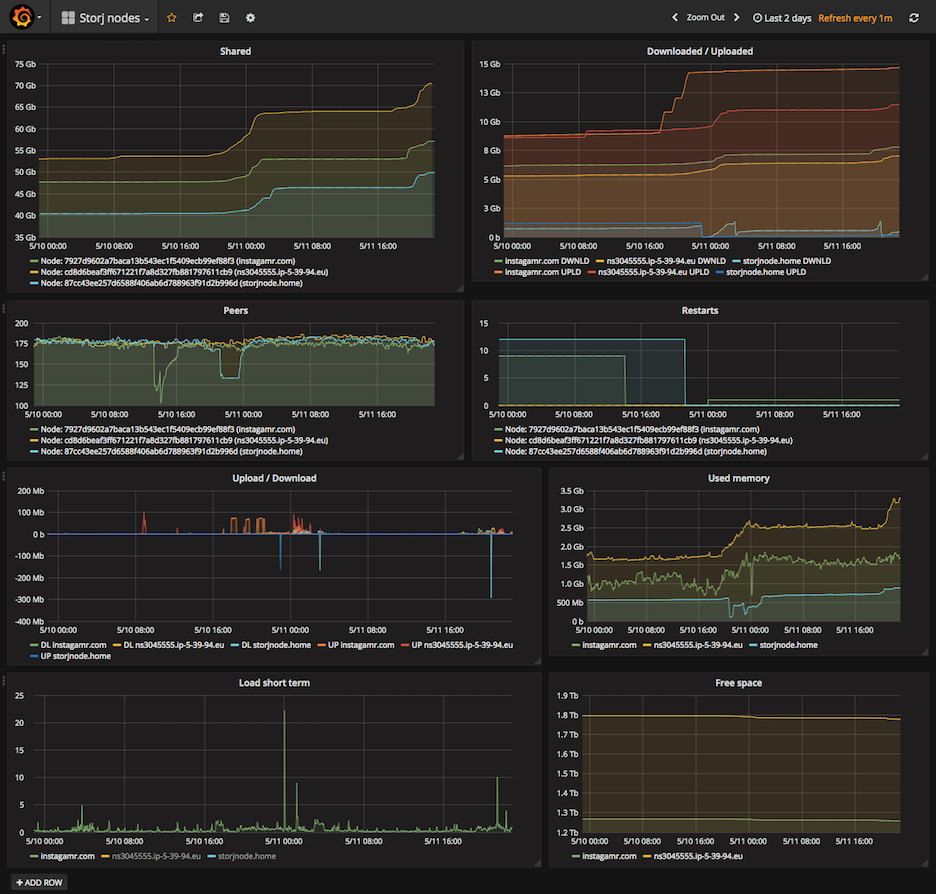
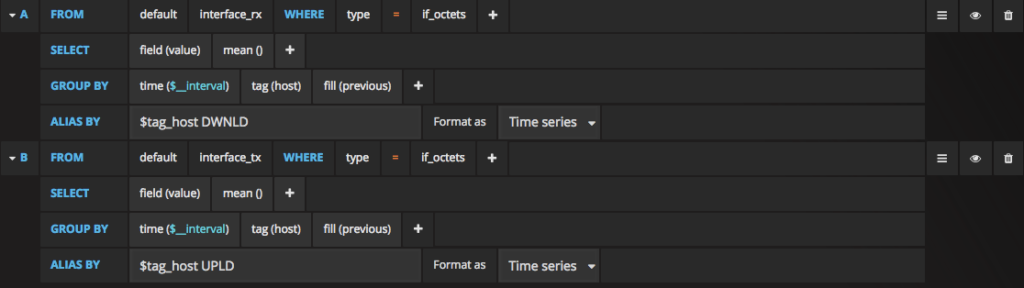
And below a few queries I used to build it.
Downloaded vs Uploaded data per host:
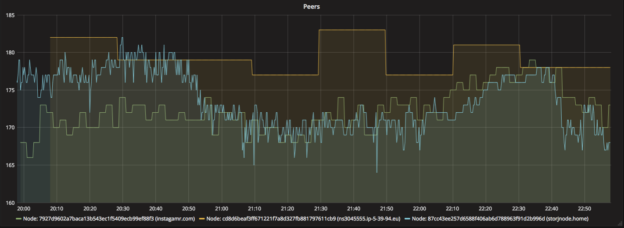
Storj peers per node:
![]()
Storj shared data per node:

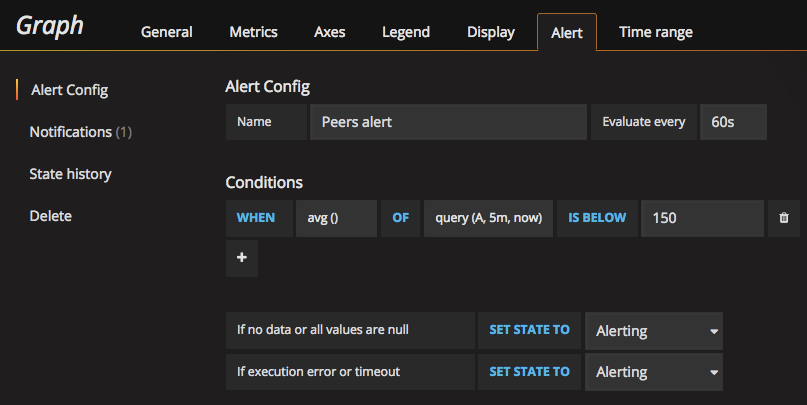
Don’t forget to add alerts on Grafana according to your needs:
After a few days of monitoring, I’m sure you should see interesting patterns emerge from your graphs! Be careful though, it’s quite hypnotic at the beginning 🙂
Hi – great idea. I am setting up something similar.
How did you create the « upload / download » and « Free Space » queries?
Hi, thank you for your nice tutorial. It would be really nice if you can also share the .json of your grafana dashboard(or even upload it to grafana.org)
Could you share your dashboard json? thanks
Thank you for a very informative article.
The queries under the section »And below a few queries I used to build it. » are super difficult to read. This is very valuable information.
Could you please provide the queries as text, or larger screen shots to make it more clear?
This worked great, thank you!
Any ideas on how to run a similar collectd exec program on a Windows-based storjshare node?
Hi and thanks for your help. What did you use for OVH? I am interested to know how to build storj farm on OVH as well. Thanks